
Bitcoin & Gold Analysis Using Fibonacci & W.D. Gann
Bitcoin & Gold Analysis Using Fibonacci & W.D. Gann
There are two methods we use at ONE44 to find support and resistance in the markets.
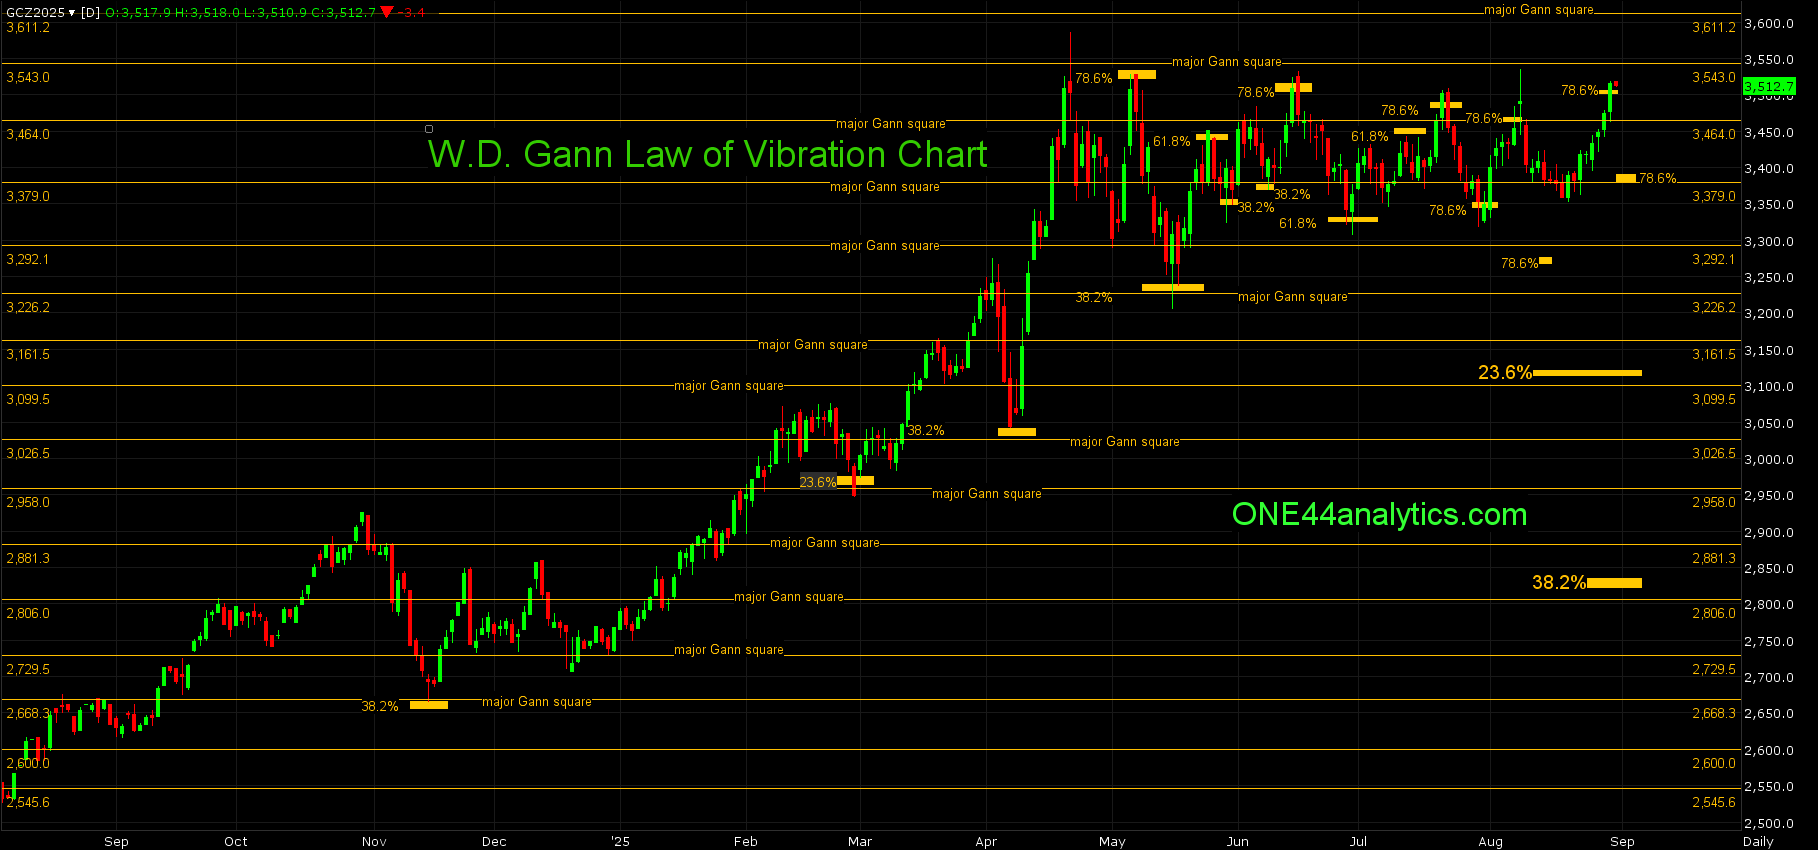
The first are major Gann squares, these are the yellow horizontal lines on the chart.
The second is Fibonacci retracements.
This is our latest Video on how to use the Fibonacci retracements with the ONE44 rules and guidelines. NEW VIDEO
In the update below we have the swing point and what to look for above and below based on the two methods of analysis.
GCZ25
From last week,
It had one big close below the 3379.00 major Gann square, only to close right back above it the next day and this will again be the key level for the week. All of the Above/Below remain the same for this week.
Use 3379.00 as the swing point for the week again.
Above it, the short term target is 78.6% back to the 8/8/25 high at 3499.00.The key....
The rally from the 3379.00 major Gann square and swing point for the last two week's hit the short term target of 78.6% at 3499.00 and closed above it, this will be the key level for the week. We will use the ONE44 78.6% rule to get the short term downside target.
Use 3379.00 as the swing point for the week.
Above it, the key level to get above in December is the 3543.00 major Gann square and once it can we think the same about another sharp rally like the one from 4/7/25 to 4/22/25. Above it, there are only major Gann squares to look for resistance and then use as the swing point when closed above, the next two are 3611.20 and 3695.90.
Below it, getting right back below 3379.00 (78.6%) and the short term target will be 78.6% the other way at 3379.00, per the ONE44 78.6% rule, this is also a major Gann square. The longer term target is 23.6% back to the 2022 low at 3279.00. The long term target is also the long term swing point at 2836.00, this is 38.2% back to the same low.
You can sign up here for free Gold, Crude Oil, SP500 & Bitcoin Updates.
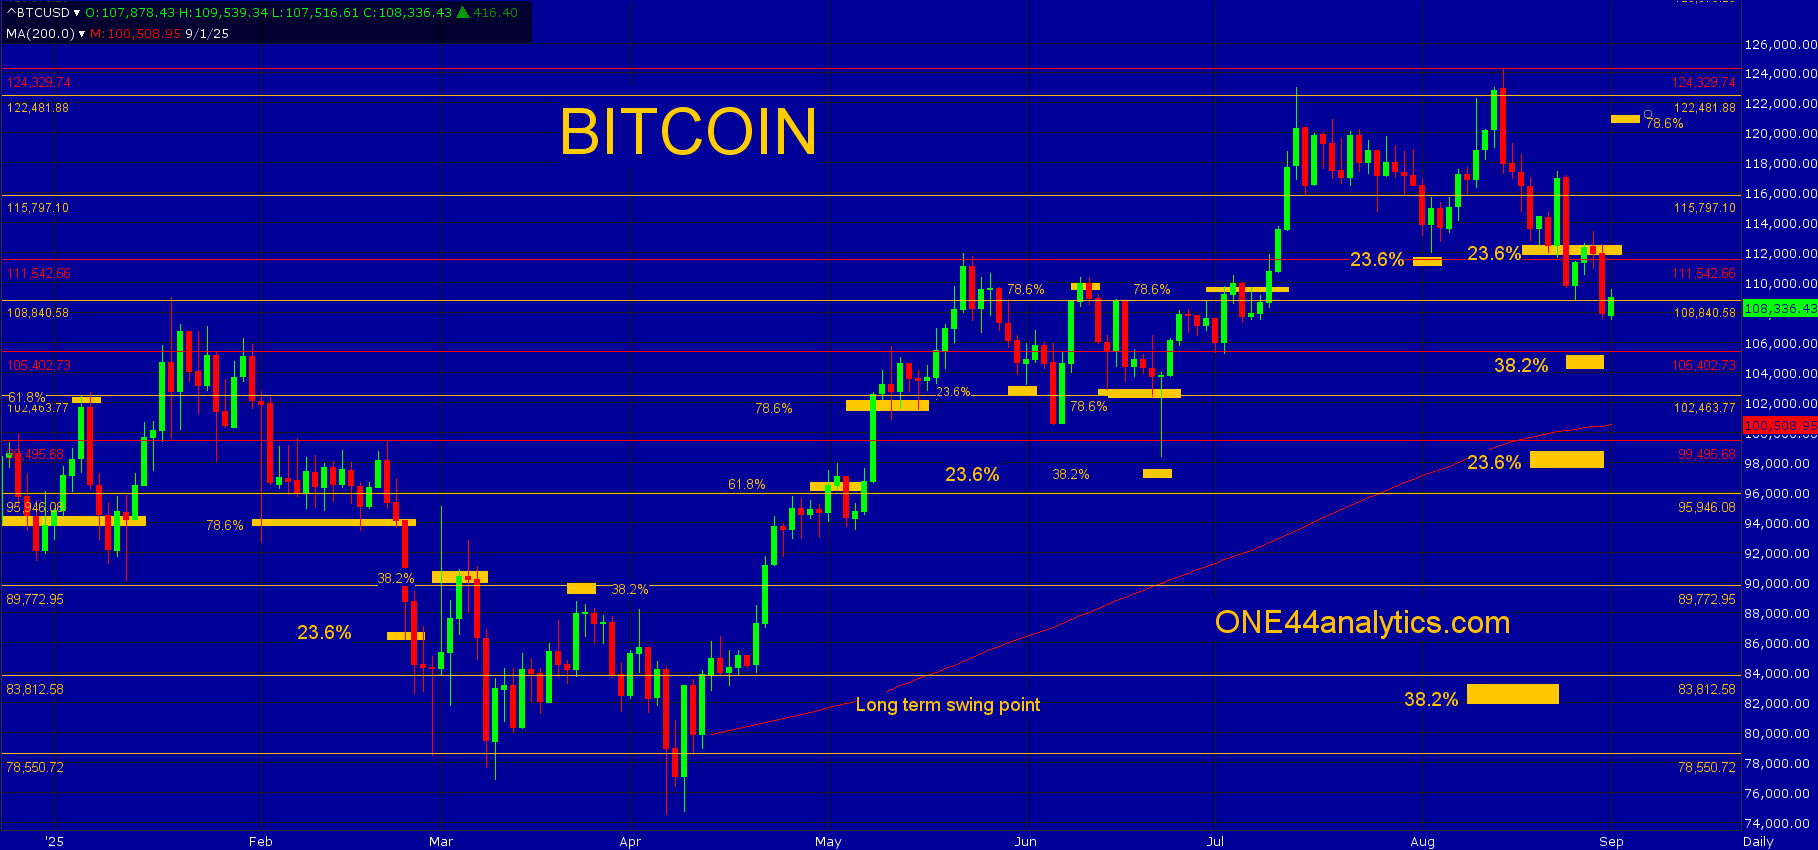
Bitcoin
From last week,
The setback from the 122.481 major Gann square held the 23.6% retracement back to the 4/7/25 low at 112,480 keeping the market extremely strong and this will be the key level for the week. We will be watching the 78.6% retracement back to the new ATH, a failure to make a new high in this area can cause a sharp selloff per the ONE44 78.6% rule.
Use 112,480 as the swing point for the week.
All of the closes this week were below the 112,480 (23.6%) swing point for the week, this will again be the key level for the week.
Use 112,480 as the swing point for the week again.
Above it, the short term target is 78.6% back to the 8/14/25 high at 120,750 a failure to turn lower from this area will give us only major Gann squares to look for resistance and then use as the swing point when closed above, the next two are 129.879 and 136,938.
Below it, the short term target is 38.2% back to the 4/7/25 low at 105,000. The longer term target is 23.6% back to the 2022 low at 105,402, this is also a major Gann square.
ONE44 Analytics where the analysis is concise and to the point
Our goal is to not only give you actionable information, but to help you understand why we think this is happening based on pure price analysis with Fibonacci retracements, that we believe are the underlying structure of all markets and Gann squares.
If you like this type of analysis and trade the Grain/Livestock futures you can become a Premium Member.
You can also follow us on YouTube for more examples of how to use the Fibonacci retracements with the ONE44 rules and guidelines.
FULL RISK DISCLOSURE: Futures trading contains substantial risk and is not for every investor. An investor could potentially lose all or more than the initial investment. Commission Rule 4.41(b)(1)(I) hypothetical or simulated performance results have certain inherent limitations. Unlike an actual performance record, simulated results do not represent actual trading. Also, since the trades have not actually been executed, the results may have under- or over-compensated for the impact, if any, of certain market factors, such as lack of liquidity. Simulated trading programs in general are also subject to the fact that they are designed with the benefit of hindsight. No representation is being made that any account will or is likely to achieve profits or losses similar to those shown. Past performance is not necessarily indicative of future results.